Data highlight
DECEMBER 1, 2019
North Dakota has the 8th highest adult obesity rate in the nation.
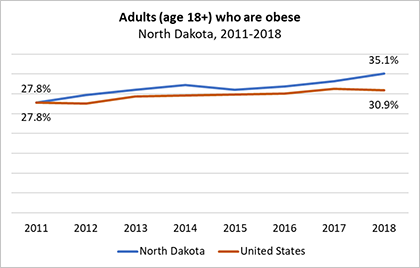
In 2011, 27.8 percent of North Dakota’s adults (age 18 and older) were obese (i.e., having a body mass index of 30.0 or higher based on reported height and weight). Compared to other states, North Dakota’s adult obesity rate was in the middle of the pack, ranking 25th highest among 50 states.
Seven years later, in 2018, North Dakota’s adult obesity rate rose to 35.1 percent, currently the 8th highest adult obesity rate in the nation. In 2018, North Dakota joined for the first time the states with an obesity rate of 35 percent and higher. In addition, according to the 2019 State of Obesity Report, 71.0 percent of adults in North Dakota were obese or overweight in 2018 (3rd highest percentage rate in the nation).
While equal to the U.S. rate in 2011, the obesity rate in North Dakota has trended above the national average ever since.
Obesity increases the risk of physical and mental health concerns and premature death. Obesity also leads to increased healthcare costs and productivity loses. While obesity has a multitude of contributing causes, social and economic conditions contribute to persistent health inequities. Policies and programs in North Dakota (e.g., nutrition assistance programs, early child care and education programs, K-12 school nutrition and physical activity programs, fiscal and tax policies that promote healthy eating, built environment policies, and diabetes prevention programs), present opportunities to support healthier lives for North Dakota residents, especially for vulnerable population groups.
NOVEMBER 1, 2019
Immigrants make up 5 percent of North Dakota’s population.
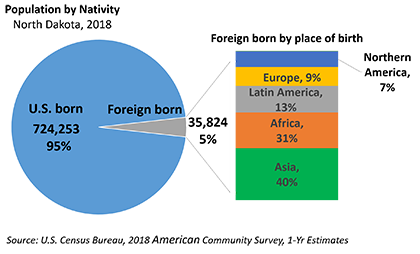
In 2018, the Census Bureau estimated that there were nearly 36,000 residents in North Dakota who were foreign born (35,824), twice as many as in 2010 (16,639), and accounting for 5 percent of the state’s population.
Foreign born include U.S. naturalized citizens and those individuals who are not U.S. citizens, but do not include those born in Puerto Rico or the U.S. Island Areas or those born to American parents abroad. In 2018, out of the foreign born population in North Dakota, 40 percent were born in Asia, 31 percent in Africa, 13 percent in Latin America, 9 percent in Europe, and 7 percent in Northern America.
VIEW TOPIC: DEMOGRAPHICS/POPULATION
OCTOBER 1, 2019
The number and percentage of older adults who are working continue to increase in North Dakota.
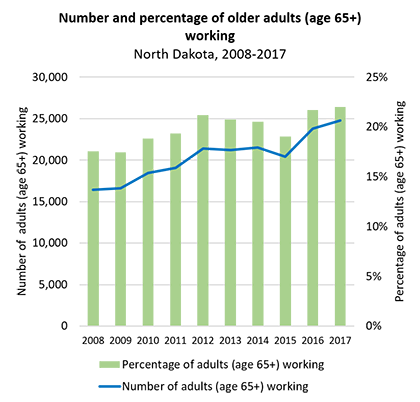
The number and percentage of North Dakotans age 65 and older who work as paid employees, in their own business or profession, or on their own farm increased in the past decade. In 2017 there were 24,777 older adults working, a 51 percent increase from 16,430 in 2008. The percentage of older adults working also increased from 18 percent in 2008 to 22 percent in 2017.
Some reasons for this increase in working adults include the aging of the baby boom generation, increased longevity, and higher educational attainment for older adults. People are living longer, and as this large cohort of boomers move into older age groups (they began turning 65 in 2011), they need to consider the increased costs of living, including medical expenses for a longer period of time. In addition, higher education levels give older adults access to jobs with higher pay and flexible work assignments, keeping them in the workforce longer.
Notes:
Adults are working (i.e., employed) if they did any work at all during a reference week as paid employees, worked in their own business or profession, worked on their own farm, or worked 15 hours or more as unpaid workers on a family farm or in a family business.
Note that the proportion of adults working is lower than the employment rate, which is calculated by dividing the number of employed people by the total number of people in the labor force. The labor force is made up of employed and unemployed people who are currently looking for work. The employment rate does not account for discouraged workers no longer seeking employment, nor for people who do not participate in the labor force for any number of reasons.
VIEW TOPIC:WORKFORCE/PROPORTION OF ADULTS WORKING
SEPTEMBER 1, 2019
High school graduation rate improved over the past decade, especially for American Indian and Hispanic students.
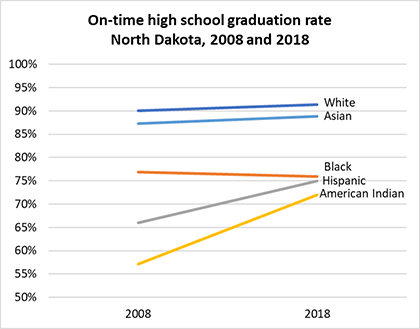
High school graduation rates improved in the past 10 years for North Dakota students of most races and ethnicities. While the overall high school graduation rate showed only a slight increase over the past decade, when disaggregating the data by race and ethnicity, American Indian and Hispanic students show the highest levels of improvement.
High school graduation rates for white and Asian students historically have trended well above rates of other races and ethnicities, and slightly increased from 2008 to 2018. Graduation rates for Black students slightly decreased from 76.9 percent in 2008 to 75.9 percent in 2018, widening the gap to Asian and white students.
Out of all racial and ethnic groups, American Indian students achieved the largest increase in the on-time graduation rate. While a little over one in two (57%) American Indian students graduated on time in North Dakota in 2008, almost three in four (72%) graduated on time in 2018 — a 15 percentage point increase in a 10-year period. In addition, two out of three Hispanic students graduated on time (66%) in 2008, compared to three out of four (75%) in 2018.
Although inequities persist, positive trends in education signal a move toward greater racial equity, particularly for Hispanic and American Indian students in North Dakota.
Note: The four-year graduation rate is calculated by dividing the number of students who graduate in four years or less with a regular high school diploma by the number of students who form the adjusted cohort for that graduating class. The adjusted cohort is a total count of first-time 9th graders in the fall of their freshman year, plus students who transfer into the cohort, minus students who transfer out of the cohort, emigrate, or die during the four school years of high school.
VIEW TOPIC:EDUCATION / HIGH SCHOOL GRADUATION
AUGUST 1, 2019
Ethnic and racial diversity in North Dakota increased in all age groups, most notably among children and young and middle-age adults.
.png)
North Dakota’s population is becoming increasingly racially and ethnically diverse. Combined, people who identify themselves as American Indian, Black, Asian, people reporting multiple races, and people who are of Hispanic ethnicity (i.e., population of color) comprised 16 percent of the total population in 2018 as compared to 11 percent in 2010. North Dakota’s population of color grew from 74,155 people in 2010 to 121,888 people in 2018 which represents a 64 percent increase, by far the largest percentage change of any state. For comparison, the U.S. population of color increased by 16 percent for the same time period, 2010 to 2018.
Younger populations in North Dakota tend to be more racially and ethnically diverse than older populations. Approximately one in four young children (age 0 to 4) was a person of color (27%) in 2018, as compared to 1 in 5 in the 20-34 age group (21%), 1 in 20 in the 65-84 age group (5%), and 1 in 50 for people age 85 and older (2%).
Racial and ethnic diversity increased in all age groups from 2010 to 2018, but the degree of change varied by age. The largest increase in diversity was among young adults age 20 to 34, for which the population of color increased by 16,205 people (7 percentage point increase). Children and youth age 5 to 19 of color increased by 11,457 (6 percentage point increase). Young children under age 5 of color and adults age 35 to 49 of color also increased, growing by 6 percentage points from 2010 to 2018.
Growing racial and ethnic diversity in North Dakota is the result of an increase in the number of non-white and Hispanic births at a rate that outpaced the growth in white, non-Hispanic births – in addition to the in-migration of a younger and more diverse group of people attracted by job opportunities in the state.
VIEW TOPIC:DEMOGRAPHICS/ AGE
JUly 1, 2019
In North Dakota, obesity rates increased in all adult age groups since 2011.
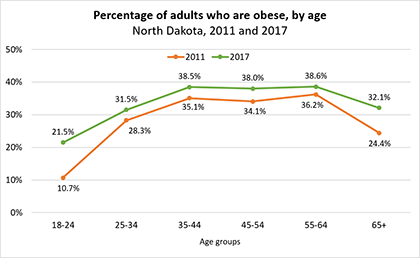
Obesity poses a major threat in all countries of the world, the United States (U.S.) included. In the U.S., the obesity rate for adults increased from 27.8 percent in 2011 to 31.1 percent in 2017. This is worrisome since obesity increases the likelihood of diabetes, cardiovascular disease, some forms of cancer, hypertension, and other chronic diseases.
In North Dakota, one-third of adults (33.2%), age 18 and older, were obese in 2017, which is a 5 percentage point increase from 27.8 percent in 2011. In 2017, North Dakota had the 13th highest adult obesity rate (rank 38 from lowest rate to highest) in the U.S.
In 2017, obesity in North Dakota was most prevalent in middle age. Adults age 55-64 had the highest obesity rate at 38.6 percent, followed by the 35-44 age group at 38.5 percent, and the 45-54 age group at 38.0 percent. The group with the lowest obesity rate was the 18-24 age group at 21.5 percent.
When comparing obesity rates from 2011 to 2017, obesity rates increased for all adult age groups. The largest and most significant increase was in the youngest adult (age 18 to 24) and older adult (65 years and older) age groups. The obesity rate for the youngest adults doubled, from 10.7 percent in 2011 to 21.5 percent in 2017. For older adults, the obesity rate increased from 24.4 percent in 2011 to 32.1 percent in 2017.
JUNE 1, 2019
Population change in North Dakota, especially in the western counties, is highly influenced by the oil and gas economy.
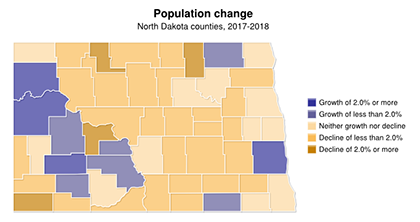
North Dakota’s population increased by 4,901 people from 2017 to 2018. The 0.6 percent increase in population ranks North Dakota 20th highest among the 50 states.
Population change has not been consistent across the state. McKenzie and Williams counties, two of the core oil and gas producing counties in North Dakota, had the highest percentages of population growth in the U.S. among counties with at least 10,000 residents (7.1% and 5.9% population growth, respectively). These increases are a continuation of growth since 2010. Compared with the 2010 decennial census, McKenzie County more than doubled its population (114% increase) and Williams County increased by more than half (58% increase). Much of the influx was due to employment opportunities in the oil and gas industries in the western part of the state.
Stark and Cass counties also saw growth, with modest population increases (approximately 2 percent) from 2017 to 2018. However, most counties continued to lose population, with Mercer, Bowman, Towner, and Renville losing more than two percent of their population from 2017 to 2018.
VIEW TOPIC:DEMOGRAPHICS/POPULATION
MAY 1, 2019
A decrease in the working-age population relative to the number of older adults has implications for the future.
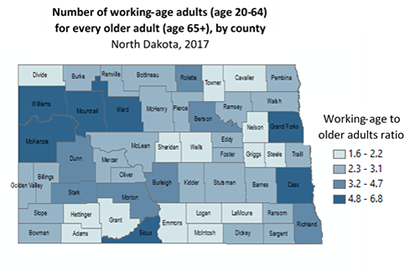
Changes in the age structure of the population have important implications for society. Nationwide, declining birth rates, in combination with increased life expectancy and the aging of the baby boomers have led to a decrease in the working-age population (age 20 to 64) relative to the older adult population (age 65 and older).
In North Dakota, there were approximately 4.4 working-age individuals for every older adult, in 1980. By 2017, the ratio dropped to 3.9. Ten years from now, the ratio is forecasted to fall to 3.1 working-age individuals for every older adult (2029 projection) in the state.
Although North Dakota has one of the lowest median ages (35.1 in 2017) and one of the highest fertility rates in the nation, the ratio of working-age individuals relative to older adults is likely to continue to decrease. Low ratios of working-age to older adults present challenges to workforce availability, retirement plans, service availability, and elder care.
In 2017, these ratios vary considerably when broken down by county, ranging from a ratio of 1.6 in Sheridan County to 6.8 in Sioux County. Several oil-producing counties and counties surrounding metropolitan areas maintain higher numbers of working-age individuals in relation to older adults. Understanding how this ratio impacts residents at more local levels (e.g., county level) allows for better-directed use of current resources and more effective strategic planning for the future.
VIEW TOPIC:DEMOGRAPHICS/AGE
APRIL 1, 2019
North Dakota’s counties experienced differential changes in child poverty rates.
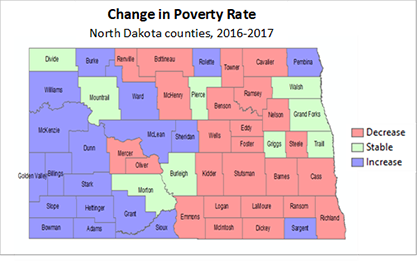
In 2017, a four-person family (i.e., two adults, two children) in the United States earning $24,858 or less was considered to be living in poverty – meaning, they lacked the necessary resources to afford basic human needs (e.g., health care, nutrition, education, clothing, shelter, child care). About 18,500 children (younger than 18) in North Dakota lived in families with incomes below poverty in 2017, resulting in a child poverty rate of 11 percent. Out of all people in poverty in North Dakota, 1 in 4 was a child under 18 years old.
North Dakota has one of the lowest child poverty rates in the U.S. (3rd lowest among states). Furthermore, the child poverty rate in North Dakota has been gradually improving since 2010. From 2010 to 2017, the child poverty rate decreased from 16 percent to 11 percent overall. In addition, the child poverty rate decreased in most of North Dakota’s counties. From 2016 to 2017, however, while about half of the counties continued to experience a decrease in the child poverty rate, some counties, especially in the western part of the state, showed an increase in the child poverty rate.
Growing up in families facing barriers to higher income can have important implications for the health and well-being of children. Understanding these data is important for developing good public policy and implementing strategic investments that can make a positive impact on children’s lives.
MARCH 15, 2019
Older adults in North Dakota are more educated than previous generations.
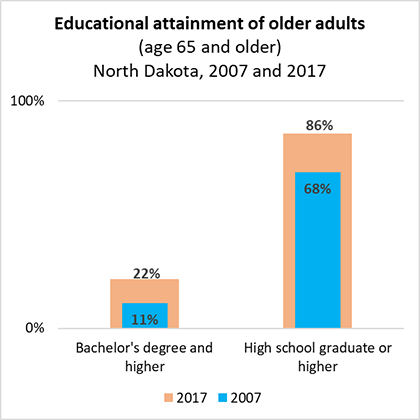
Higher levels of education, which promote the development of technical skillsets and innovative capacities, are linked to increased incomes for individuals, as well as improved state and local economies. By furthering their education, North Dakotans can prepare themselves and their communities for a better future.
Levels of educational attainment of individuals in North Dakota have changed over the recent past. In 2007, 11 percent of residents age 25 years and older had attained less than a high school education. By 2017, 7 percent had attained less than a high school education. In contrast, the percentage of residents age 25 years and older with a bachelor’s degree or higher increased five percentage points from 2007 to 2017 (25.7% and 30.7%, respectively).
Overall, most generations are more educated than ten years ago with older adults seeing the largest increase in educational attainment. A larger proportion of adults age 65 and older have graduated from high school (86% in 2017 compared to 68% in 2007) and attained a bachelor’s degree or higher (an increase from 11% in 2007 to 22% in 2017) as compared with ten years ago.
Higher levels of education provide older workers with some benefits. Older adults with higher educational attainment are more likely to work past retirement age and less likely to be employed in physically-demanding jobs or jobs with difficult working conditions. They also are more likely to have access to flexible work arrangements (The Sloan Center on Aging & Work at Boston College).
VIEW TOPIC:WORKFORCE/EDUCATIONAL ATTAINMENT
MARCH 1, 2019
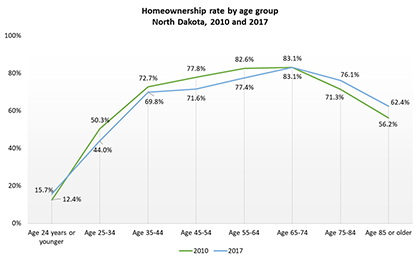
Homeownership rates increased for households headed by older adults in North Dakota.
Owning a home includes opportunities for asset-building and stability and renting provides more mobility and flexibility. Individuals and families experience alternating periods of renting and owning throughout their lifetimes, influenced by various economic and demographic factors.
People in North Dakota are more likely to own than to rent, but the homeownership rate in North Dakota is lower than the homeownership rate of 39 other states in the U.S. Homeownership rates in North Dakota have held steady since 2000 and remained comparable to national rates in 2017 (63.4% and 63.9%, respectively). In North Dakota, homeownership rates were highest among those age 65-74 (83.1%), and lowest among those age 24 and younger (15.7%) in 2017. Rates for the second youngest cohort (age 25-34) decreased 5.6 percentage points from the previous year, while rates for the oldest cohort (age 85 and older) rose 5.2 percentage points from the previous year.
Compared to 2010, while the homeownership rate decreased for most age groups, it increased for householders age 65 and older (4.8 percentage points for householders age 75-84 and 6.2 percentage points for householders age 85 and older). Baby boomers (i.e., those born 1946-1964) are driving some of this growth. From 2010 to 2017, the number of older adults age 65 and older in North Dakota increased by 16 percent and the number of households headed by people in this age group also increased by 16 percent. The increase in homeownership rates among older adults may also result from a growing number of individuals aging in place. Additionally, changes in household structures, such as multigenerational living arrangements, may also be a contributing factor in the rise of homeownership rates among older adults (Housing America's Older Adults, 2018).
Notes:
In the American Community Survey, one person in each household is designated as the householder (head of household). In most cases, this is the person or one of the people in whose name the home is owned, being bought, or rented and who is listed on line one of the survey questionnaire. If there is no such person in the household, any adult household member 15 years old and over could be designated as the householder.
VIEW TOPIC:HOUSING/HOMEOWNERSHIP RATE
FEBRUARY 15, 2019
Gap in employment has narrowed between white (non-Hispanic) adults and adults of color.
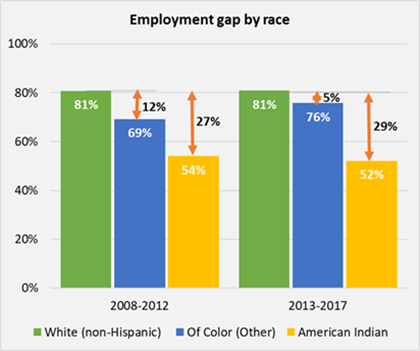
Overall, in 2017, North Dakota ranked first among the 50 states, with 80 percent of adults (age 16-64) being employed. Despite this high rank, North Dakota has one of the largest employment gaps in the nation between white (non-Hispanic) and American Indian and also white (non-Hispanic) and persons of color (other) which include Asian, Black, two or more races, or another races.
In 2017, 81 percent of people who identify themselves as white (non-Hispanic) were employed, as compared to 76 percent of people of color (other) and 52 percent of American Indians. Compared to 2012, while the gap between the percentage of white and American Indian who were working became slightly larger from 27 percentage points to 29 percentage points, the gap between the percentage of white and the population of color who were working narrowed from 12 percentage points to 5 percentage points.
Notes:
The category "Of Color (Other)" includes all persons who are Asian, Black, or Two or more races, or those who identify themselves as belonging to another race.
Adults are considered to be working (employed) if they did any work at all during a reference week as paid employees, worked in their own business or profession, worked on their own farm, or worked 15 hours or more as unpaid workers on a family farm or in a family business. Also included are adults who were “with a job but not at work,” including those who were temporarily absent from their jobs or businesses due to illness, bad weather, industrial dispute, vacation, or other personal reasons.
VIEW TOPIC:WORKFORCE/ PROPORTION OF ADULTS WORKING
FEBRUARY 1, 2019
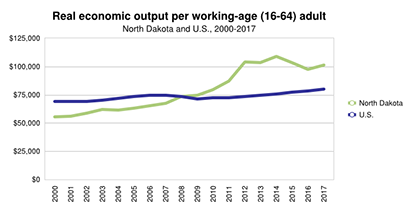
North Dakota ranks first among the 50 states in economic output per working-age adult.
The gross domestic product (GDP) is the measure of the market value of all final goods and services produced by labor and property located in a specific region. GDP by state is the state counterpart of the nation's gross domestic product, the most comprehensive measure of U.S. economic activity. GDP by state is derived as the sum of the GDP originating in all the industries in a state.
North Dakota’s Gross Domestic Product was $49 billion in 2017, representing a one percent increase from the previous year. While the increase is small and follows two years of negative change, the economy overall is substantially larger than it was 10 years ago. The 2000 -2017 real GDP compound annual growth rate was 4.7 percent in North Dakota as compared to 1.7 percent in the U.S., which is the highest among all 50 states.
North Dakota also ranked first among 50 states for the GDP per working-age adult (16-64 years old). In 2017, North Dakota generated $101,374 in economic activity per working-age adult, exceeding the national average of $79,731. North Dakota’s GDP per working-age adult has exceeded the national average for nine years with the largest gap from 2012 to 2014.
Note:
The statistics of real GDP by state are prepared in chained (2009) dollars. Real GDP by state is an inflation–adjusted measure of each state's gross product that is based on national prices for the goods and services produced within that state. The statistics of real GDP by state and of quantity indexes with a base year of 2009 were derived by applying national chain–type price indexes to the current–dollar GDP–by–state values for the 64 detailed NAICS–based industries for 1997 forward and for the 63 detailed SIC–based industries for 1977—1997.
VIEW TOPIC: ECONOMY / ECONOMIC OUTPUT (GDP)
JANUARY 15, 2019
North Dakota's young adults have the highest uninsured rates compared to other age groups in the state.
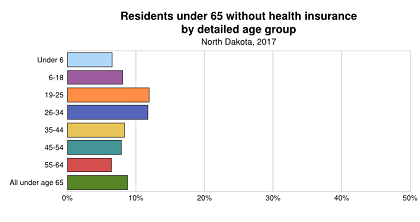
Health insurance is the best way to ensure access to health care. According to the Kaiser Commission on Medicaid and the Uninsured, individuals without health insurance are less likely to receive preventive care or care for routine medical conditions and injuries, which if left untreated, can lead to more serious illnesses and health problems. This, in turn, can result in preventable hospitalizations and deaths.
In North Dakota the number and the percentage of people under age 65 without health insurance rose slightly from 51,861 (8.1%) in 2016 to 55,291 (8.8%) in 2017. Relative to other states in the U.S., North Dakota ranked in the middle of the pack (rank of 23) for the lowest share of residents, under age 65, who are without health insurance.
In 2017, young adults, 19 to 25 and 26 to 34 years old, were most likely to be uninsured (11.9% and 11.8%, respectively) compared to other age groups in North Dakota. From ages 35 to 64, the uninsured rate generally declined with age to an uninsured rate of 6.4 percent for 55 to 64 year olds, which is the lowest of any age group among the nonelderly population. Children generally had lower uninsured rates as well (6.5% for children under 6 years old and 8.1% for children age 6 to 18).
VIEW TOPIC:HEALTH/HEALTH CARE COVERAGE
JANUARY 1, 2019
Recently released population estimates shows slight increase in North Dakota’s population.
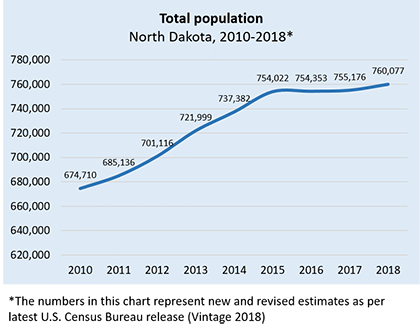
After five years of continuous growth (2010-2015), North Dakota’s population remained relatively unchanged from 2015 to 2017. However, from 2017 to 2018, North Dakota’s population increased with 4,901 people, according to the most recent population estimates released by the US Census Bureau. Most of the increase in population is attributed to natural growth (4,656 more births than deaths). The net migration, although low (218), turned positive for the first time after 2015, with more people entering than leaving the state in 2017-2018. The 0.6 percent increase in population from 2017 to 2018, ranks North Dakota 19th highest among the 50 states in percentage increase.
On a larger scale, from 2010 to 2018, North Dakota gained 87,501 people, 36,744 from natural increase and 49,192 from net migration. This represents a 13 percent increase and ranks North Dakota 5th highest in percentage increase during this time period among the 50 states. Only four states — Colorado, Florida, Texas and Utah — are estimated to have grown by a higher percentage since 2010.
With the current estimate, North Dakota retains its status as the 47th most populous state, with only Alaska, Vermont, and Wyoming ranking below.
(U.S. Census Bureau, 2018 Population and Housing Unit Estimates).
Notes:
Populations can change in three ways: people may be born (births), they may die (deaths), or they may move (domestic and international migration). The U.S. Census Bureau’s Population Estimates program measures this change and adds it to the last decennial census to produce updated population estimates every year.
Net migration = number of people who enter the state (in-migration) minus the number of people who leave the state (out-migration); Natural change = Number of births minus number of deaths; Total population change = Net migration + Natural change
With each annual release of population estimates, the Population Estimates program revises and updates the entire time series of estimates from the last Census to the current year. (U.S. Census Bureau - Methodology for the United States population estimates).
VIEW TOPIC:DEMOGRAPHICS/POPULATION
Center for Social Research
North Dakota State University
Compass created by:
Wilder Research
© 2025. All rights reserved.